In July 2026, China's new energy vehicle penetration exceeded 64% for the first time, reaching 64.5%. Chengdu sold 82,456 units, surpassing Shanghai and Beijing to become the nation's top car sales city. PHEV share rose to 38%, becoming the core driver of penetration growth.
Penetration Breaks 64.5%, NEV Market Reaches New Heights
According to CPCA July 2026 data:
July Passenger Vehicle Market Overview
| Metric | July Data | YoY | MoM | Jan-July Cumulative |
|---|---|---|---|---|
| Total PV sales | 2.286M | +3.2% | -5.1% | 15.268M |
| NEV sales | 1.474M | +28.5% | +2.3% | 9.123M |
| NEV penetration | 64.5% | +12.3pp | +2.8pp | 59.8% |
| ICE sales | 812K | -22.3% | -13.6% | 6.145M |
What 64.5% penetration means:
- 6.5 out of every 10 new cars sold are NEV
- ICE sales down 22.3% YoY, accelerating decline
- NEV penetration up 12.3pp from 52.2% in July 2025
NEV Internal Structure
| Power Type | July Sales | Share | YoY | MoM |
|---|---|---|---|---|
| BEV | 914K | 62.0% | +22.1% | +1.5% |
| PHEV | 560K | 38.0% | +41.2% | +4.2% |
| Total | 1.474M | 100% | +28.5% | +2.3% |
PHEV share rose to 38%, becoming the core force driving penetration growth.
City Sales Pattern: Chengdu Tops National Ranking
July City Sales TOP10
| Rank | City | July Sales | NEV Penetration | YoY | Notes |
|---|---|---|---|---|---|
| 1 | Chengdu | 82,456 | 58.2% | +18.5% | First time top |
| 2 | Shanghai | 78,234 | 72.1% | +5.2% | License plate restricted |
| 3 | Beijing | 71,567 | 68.5% | +3.8% | License plate restricted |
| 4 | Guangzhou | 65,234 | 63.4% | +12.3% | License plate restricted |
| 5 | Shenzhen | 58,967 | 75.6% | +15.6% | License plate restricted |
| 6 | Hangzhou | 54,321 | 71.2% | +22.1% | New tier-1 |
| 7 | Chongqing | 52,456 | 55.8% | +25.3% | New tier-1 |
| 8 | Suzhou | 48,234 | 62.3% | +14.7% | Strong tier-2 |
| 9 | Wuhan | 45,678 | 54.2% | +19.8% | Strong tier-2 |
| 10 | Xi'an | 42,345 | 51.6% | +28.4% | Strong tier-2 |
Chengdu tops the national ranking for the first time, breaking Shanghai and Beijing's long-standing dominance.
Behind Chengdu's Rise: Western Auto Consumption Center
Why Chengdu?
- Population & purchasing power: 21.4M residents, #4 largest city; 52K yuan per capita income, western #1
- Policy advantage: No license plate restriction; up to 3,000 yuan local NEV subsidy
- Geography & logistics: Western auto distribution hub, connecting 300M population; 15-20% lower logistics costs
- Industrial base: FAW-VW, FAW-Toyota, Volvo, Dongfeng PSA factories; 2M+ annual capacity
Chengdu Auto Consumption Characteristics
| Dimension | Chengdu | vs Shanghai/Beijing |
|---|---|---|
| Brand preference | Local brands 55% | Shanghai: JV brands 60% |
| Price range | 150K-250K yuan highest | 250K-350K yuan highest |
| NEV preference | PHEV 48% | BEV 65% |
| SUV share | 52% | 42% |
| Replacement rate | 38% | 52% |
License Plate Restriction vs. Non-Restriction: Two Paths
Restriction Cities: Policy-Driven
| City | NEV Penetration | Drivers | Characteristics |
|---|---|---|---|
| Shenzhen | 75.6% | Restriction + NEV priority | BEV dominant, premium share high |
| Shanghai | 72.1% | Restriction + non-local plate ban | PHEV + BEV balanced |
| Hangzhou | 71.2% | Restriction + regional ban | New forces brands high |
| Beijing | 68.5% | Quota tilts toward NEV | Tesla, BYD dominant |
Non-Restriction Cities: Market-Driven
| City | NEV Penetration | Drivers | Characteristics |
|---|---|---|---|
| Chongqing | 55.8% | Industrial base + consumption upgrade | Local OEMs drive |
| Wuhan | 54.2% | Value-for-money | BYD, Wuling dominant |
| Xi'an | 51.6% | Subsidies + charging convenience | PHEV dominant |
| Chengdu | 58.2% | Non-restriction + purchasing power | Local brands + PHEV |
Brand Landscape: BYD Leads, New Forces Diverge
July NEV Brand Sales TOP10
| Rank | Brand | July Sales | Penetration Contribution | YoY | Key Models |
|---|---|---|---|---|---|
| 1 | BYD | 418,756 | 28.4% | +25.3% | Qin PLUS, Song PLUS, Seagull |
| 2 | Tesla | 72,345 | 4.9% | +8.7% | Model Y, Model 3 |
| 3 | Li Auto | 51,234 | 3.5% | +32.1% | L6, L7, L8 |
| 4 | Wuling | 48,567 | 3.3% | +18.5% | Bingo, Mini EV, Starlight |
| 5 | AITO | 42,345 | 2.9% | +45.6% | M9, M7, M5 |
| 6 | Leapmotor | 38,234 | 2.6% | +52.3% | C10, C11, T03 |
| 7 | Zeekr | 32,456 | 2.2% | +28.7% | 001, 007, 009 |
| 8 | NIO | 28,567 | 1.9% | +15.2% | ES6, ET5, EC6 |
| 9 | XPeng | 26,345 | 1.8% | +22.4% | P7, G6, X9 |
| 10 | Changan | 25,678 | 1.7% | +12.3% | Deepal SL03, UNI-V |
PHEV Rising: From "Transitional" to "Mainstream"
July PHEV sales: 560K, +41.2% YoY, far outpacing BEV (+22.1%).
Top 5 PHEV Models
| Rank | Model | July Sales | Price Range | Key Selling Point |
|---|---|---|---|---|
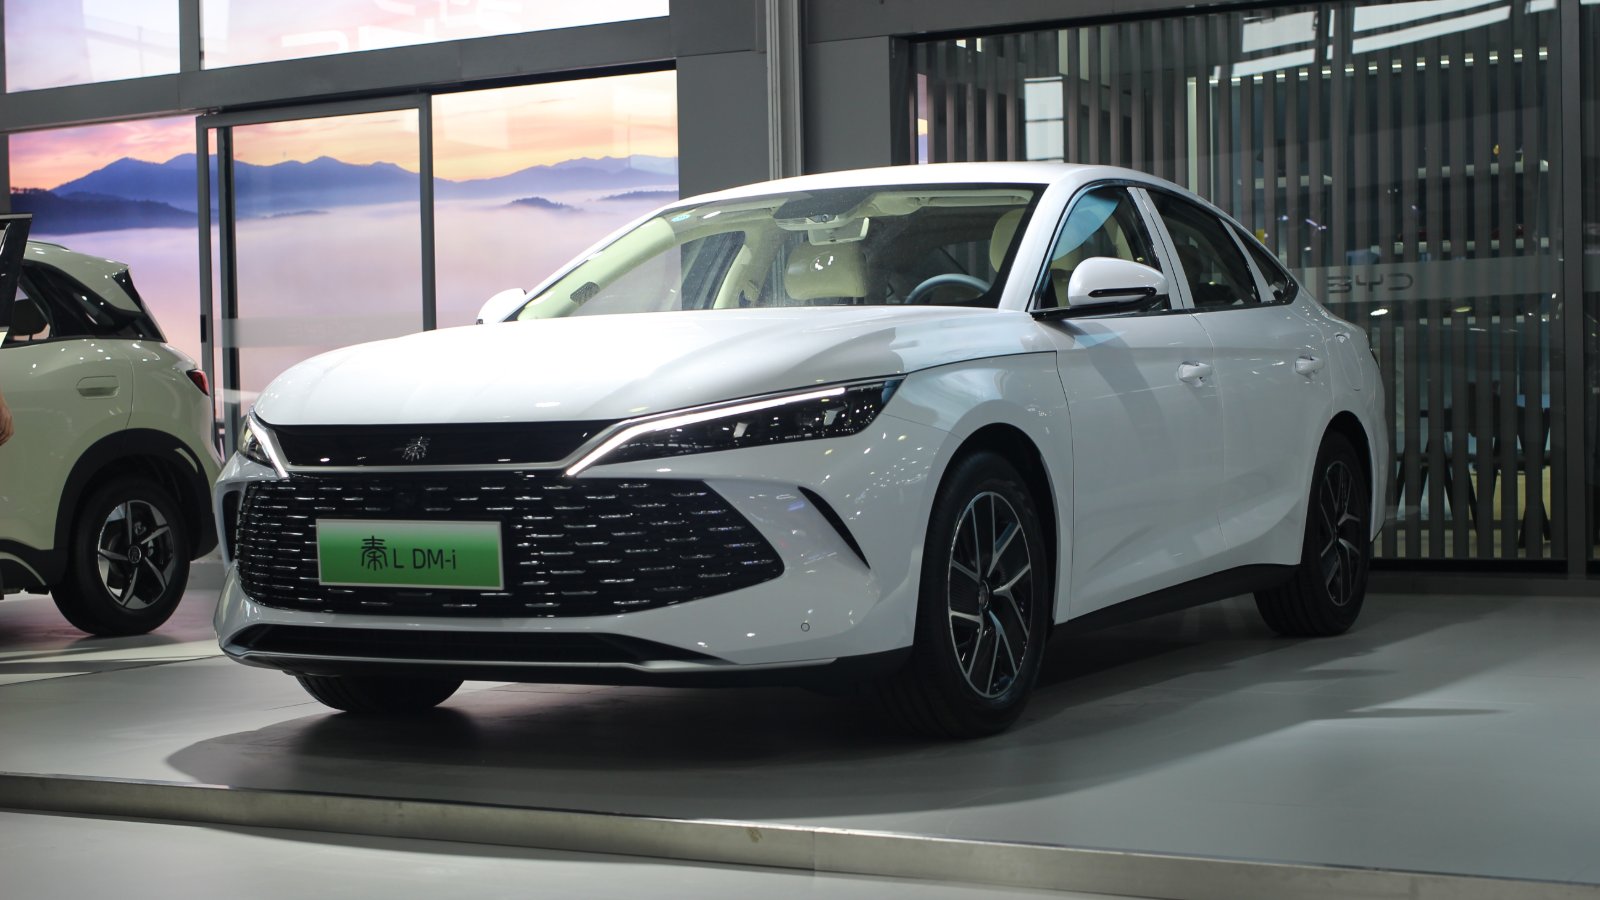
| 1 | BYD Qin PLUS DM-i | 32,456 | 90K-140K yuan | 3.8L/100km, 1,200km range |
| 2 | Li Auto L6 | 18,234 | 250K-300K yuan | EREV + space + intelligence |
| 3 | BYD Song PLUS DM-i | 16,567 | 130K-180K yuan | Family SUV of choice |
| 4 | AITO M7 | 12,345 | 250K-320K yuan | Huawei ADAS + Harmony OS |
| 5 | Wuling Starlight | 10,234 | 80K-110K yuan | Value champion |
PHEV vs BEV: Consumer Choice
| Dimension | PHEV | BEV | Suitable For |
|---|---|---|---|
| Purchase cost | 10-15% lower | Higher | Budget-sensitive |
| Usage cost | Low daily/high long | Low overall | Home charging available |
| Range anxiety | None | Yes | Frequent long trips |
| Intelligence | Slightly weaker | Stronger | Tech enthusiasts |
| Resale value | Slightly lower | Lower | Short-term holding |
Outlook: When Will Penetration Break 70%?
Key variables:
- Policy continuation: NEV purchase tax exemption expires end-2027
- Infrastructure: Tier-3/4 cities charging coverage below 30%
- Product supply: Limited choices below 100K yuan
- Oil prices: Above 9 yuan/liter would further stimulate NEV demand
Projections:
- End 2026: Annual average penetration 62-65%
- Mid 2027: Monthly penetration could break 70%
- End 2027: Annual average 68-72%
- 2030: Stabilizing at 80-85%
NEV penetration exceeding 64.5% marks China's auto industry entering the "NEV-dominant era." Chengdu topping national sales confirms the western market's huge potential.
More detailed market data and city sales analysis is available at EX1000.COM.