Global NEV deliveries reached 9.906 million units in H1 2026, up just 5.5% YoY. While China and the US decelerate in tandem, Europe, Southeast Asia and emerging markets are surging ahead, rewriting the global electrification map.
Data Snapshot: Twin Engines Slow in Unison
In 2026, the global new energy vehicle market entered a low-growth corridor. According to SNE Research, H1 deliveries totaled 9.906 million units, rising only 5.5% year-on-year—a marked slowdown from previous years.
The regional breakdown reveals dramatic shifts:
- China: 5.308 million deliveries, down 9.5% YoY
- North America: 681,000 deliveries, down 20.5% YoY
- Europe: up 29% to 2.528 million
- Asia (ex-China): up 75.8% to 933,000
- Other emerging markets: up 150.6% to 456,000
The combined China-US share dropped from 71.5% to 60.5% year-on-year. The dual-engine growth model is being dismantled.
China: From Policy Preference to Equal Treatment
China's NEV slowdown reflects a fundamental driver switch. Effective September 1, 2026, lithium-ion batteries face a 2% consumption tax. Purchase-tax exemptions have halved, and vehicle-and-vessel tax benefits are phasing out. The "policy dividend era" is officially over; the industry now enters the "equal oil-electric treatment" phase.
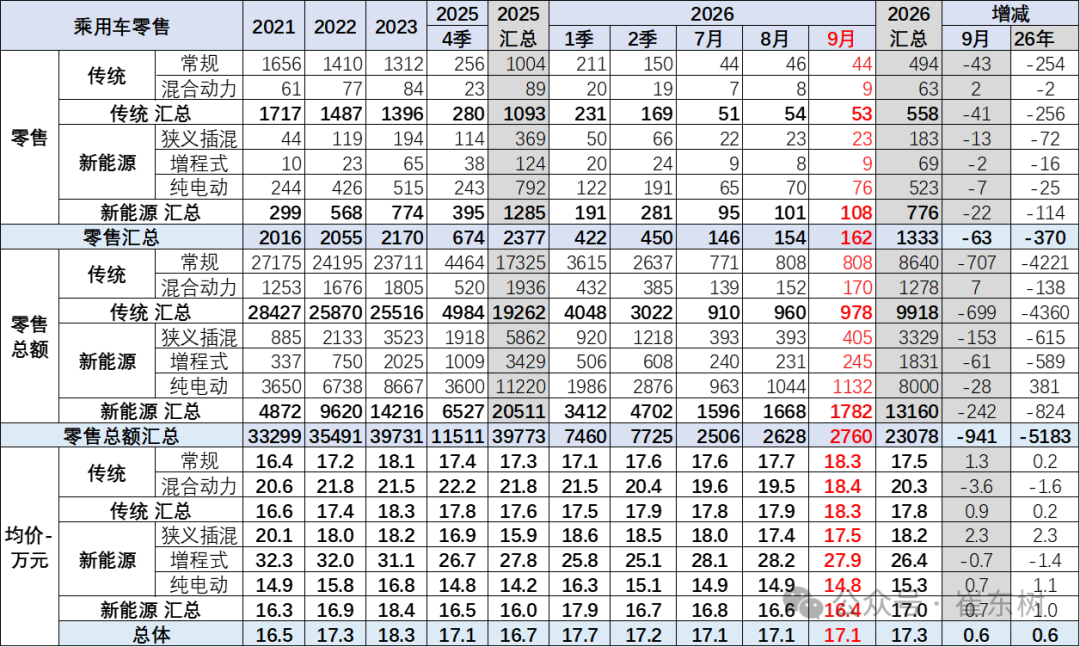
Yet the market foundation remains solid. CPCA data shows July 2026 NEV retail penetration hit 65.1%, the fourth consecutive month above 60%. Cumulative Jan-July retail reached 5.675 million units. High penetration indicates consumer choice has shifted from policy-driven to market-driven.
Internal restructuring continues:
- BEV share within NEV climbed to 67.1%
- PHEV and EREV growth decelerated
- Industry profit margin fell to 3.8%, a ten-year low
US: Collapse After Policy Pillars Removed
Unlike China's price adjustment digestion, the US decline stems directly from withdrawn policy support. Uncertainty around federal EV tax credits, combined with tariff barriers, has kept US EV penetration stalled in the 6%-7% range.
IEA projects a possible H2 recovery, but full-year US auto sales will still fall below 2025 levels. The current penetration rate may not be a long-term ceiling, but it is a real ceiling under current pricing structures.
Emerging Markets: Affordability Drives the Relay
The most compelling global electrification story is unfolding outside China and the US. IEA price data shows the BEV premium over ICE vehicles narrowing at unexpected speed across emerging markets:
| Market | 2022 Premium | 2025 Premium | Change |
|---|---|---|---|
| Brazil | 168% | 11% | -157pp |
| Turkey | 217% | 11% | -206pp |
| Mexico | — | 3% | — |
| Thailand | — | 3% | — |
| India | 247% (2023) | 53% | -194pp |
China and Norway lead the pack—BEV prices are already below ICE, by 20% and 8% respectively. The regions with the fastest price convergence overlap almost exactly with the fastest-growing markets. Where affordability arrives, growth follows.
Southeast Asia exemplifies this trend:
- Thai EV prices have matched ICE for two consecutive years; Q1 2026 sales exceeded 60,000 units
- Indonesia's average EV premium dropped from over 50% in 2024 to roughly 40% in 2025
- Chinese NEV cost competitiveness is spilling over into broader Asian growth
Outlook: From Scale Expansion to Quality Build
Global EV sales in 2026 are projected at roughly 23 million units, up about 10% YoY, accounting for 29% of global auto sales. China's full-year volume is expected at approximately 13.2 million, roughly flat versus 2025. Higher growth rates will come from Europe, Latin America, Australia-New Zealand, India and Southeast Asia.
For the global automotive supply chain, this implies:
- Battery and component companies must pivot from "China+US/EU" to "China+Global" strategies
- Channel development in Central Asia, Russia and Southeast Asia becomes a competitive battleground
- Price competitiveness and localization capability will determine who wins incremental markets
For more in-depth industry analysis, visit EX1000.COM.